PostgreSQL official repos cut off global mirror sync channels, open-source binaries supply disrupted, revealing the true colors of various database and cloud vendors.
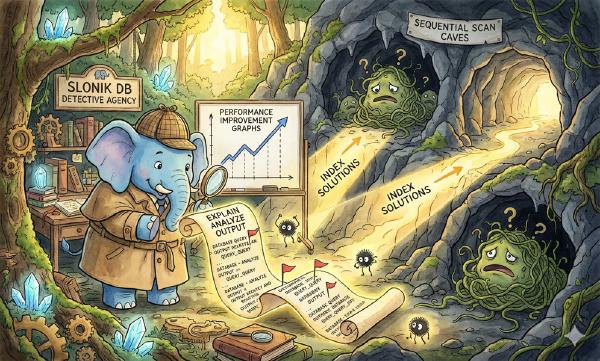
Query optimization is one of the core responsibilities of DBAs. This article introduces how to use metrics provided by pg_stat_statements for macro-level PostgreSQL query optimization.
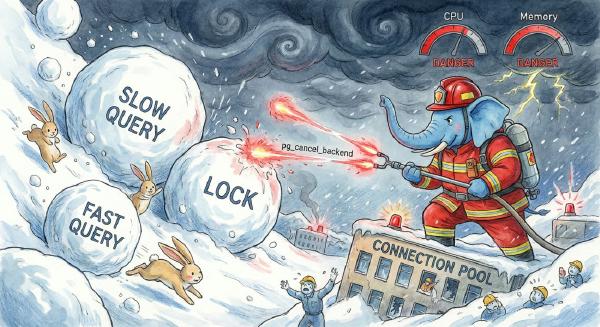
Slow queries are the sworn enemy of OLTP databases. Here’s how to identify, analyze, and fix them using metrics (Pigsty dashboards), pg_stat_statements, and logs.
Concepts and their naming are very important. Naming style reflects an engineer’s understanding of system architecture. Poorly defined concepts lead to communication confusion, while carelessly set names create unexpected additional burden. Therefore, they need careful design.
Managing databases is similar to managing people - both need KPIs (Key Performance Indicators). So what are database KPIs? This article introduces a way to measure PostgreSQL load: using a single horizontally comparable metric that is basically independent of workload type and machine type, called PG Load.
Sometimes, interactions between components manifest in subtle ways. For example, using pg_dump to export data from a connection pool can cause connection pool contamination issues.
Recently there was a perplexing incident where a database had half its data volume and load migrated away, but ended up being overwhelmed due to increased load.
Wireshark is a very useful tool, especially suitable for analyzing network protocols. Here’s a simple introduction to using Wireshark for packet capture and PostgreSQL protocol analysis.
With file_fdw, you can easily view operating system information, fetch network data, and feed various data sources into your database for unified viewing and management.