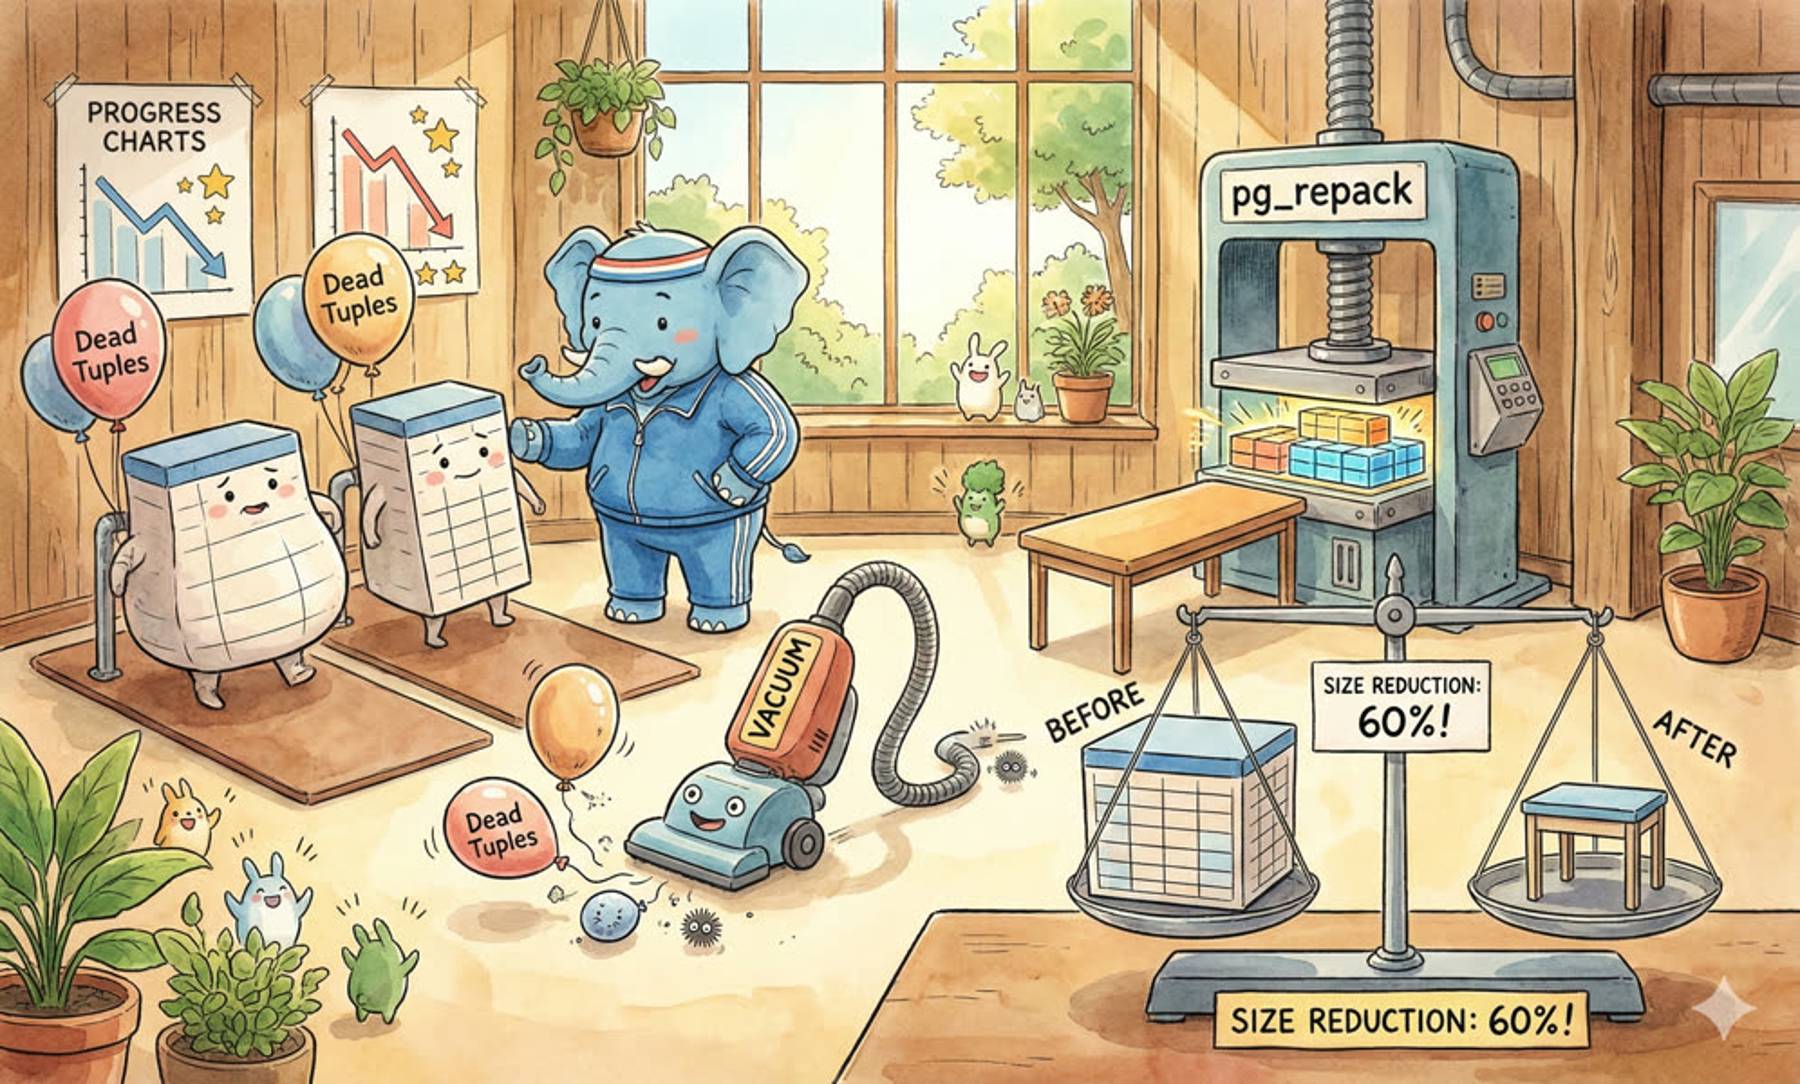
Relation Bloat Monitoring and Management

PostgreSQL uses MVCC as its primary concurrency control technology. While it has many benefits, it also brings other effects, such as relation bloat. Relation bloat (table and index) negatively impacts database performance and wastes disk space. To keep PostgreSQL always at optimal performance, it’s necessary to perform timely garbage collection on bloated relations and regularly rebuild excessively bloated relations.
In actual operations, garbage collection isn’t that simple. Here are a series of issues:
- What causes relation bloat?
- How to measure relation bloat?
- How to monitor relation bloat?
- How to handle relation bloat?
This article will explain these issues in detail.
Relation Bloat Overview
Suppose a relation actually occupies 100G of storage, but much space is wasted by dead tuples, fragments, and free areas. If it were compressed into a new relation, it would occupy 60G, then we can approximately consider this relation has a bloat rate of (100 - 60) / 100 = 40%.
Regular VACUUM cannot solve table bloat issues. Dead tuples themselves can be reclaimed by concurrent VACUUM mechanisms, but the fragments and holes they create cannot. For example, even after deleting many dead tuples, the table size cannot be reduced. Over time, relation files become filled with many holes, wasting substantial disk space.
The VACUUM FULL command can reclaim this space by copying live tuples from the old table file to a new table, compacting the table by rewriting the entire table. However, in actual production, this operation holds an AccessExclusiveLock on the table, blocking normal business access, making it unsuitable for non-stop services. pg_repack is a practical third-party plugin that can perform lock-free VACUUM FULL while online business continues normally.
Unfortunately, there’s no best practice for when to perform VACUUM FULL to handle bloat. DBAs need to formulate cleanup strategies for their specific business scenarios. However, regardless of the strategy adopted, the mechanisms for implementing these strategies are similar:
- Monitor, detect, and measure relation bloat levels
- Handle relation bloat based on bloat level, timing, and other factors
Here are some key questions: first, how to define relation bloat rate?
Measuring Relation Bloat
To measure relation bloat levels, we first need to define a metric: bloat rate.
The calculation idea for bloat rate is: estimate the space that would be occupied if the target table were in a compact state through statistical information, and the proportion of actual used space exceeding this compact space is the bloat rate. Therefore, bloat rate can be defined as 1 - (total bytes occupied by live tuples / total bytes occupied by relation).
For example, if a table actually occupies 100G of storage, but much space is wasted by dead tuples, fragments, and free areas, and if compressed into a new table it would occupy 60G, then the bloat rate is 1 - 60/100 = 40%.
Getting relation size is relatively simple and can be obtained directly from system catalogs. So the key issue is how to obtain total bytes of live tuples.
Precise Calculation of Bloat Rate
PostgreSQL comes with the pgstattuple module, which can be used to precisely calculate table bloat rates. For example, the tuple_percent field here is the percentage of actual tuple bytes to total relation size. Subtracting this value from 1 gives the bloat rate.
pgstattuple is very useful for precisely determining table and index bloat. For specific details, refer to the official documentation: https://www.postgresql.org/docs/current/static/pgstattuple.html.
Additionally, PostgreSQL provides two built-in extensions, pg_freespacemap and pageinspect. The former can be used to examine the free space size in each page, while the latter can precisely show the physical storage content within each data page in relations. If you want to examine the internal state of relations, these two plugins are very practical. Detailed usage can be found in the official documentation:
https://www.postgresql.org/docs/current/static/pgfreespacemap.html
https://www.postgresql.org/docs/current/static/pageinspect.html
However, in most cases, we don’t care too much about the precision of bloat rates. In actual production, the requirements for bloat rates aren’t high: having the first significant digit accurate is generally sufficient. On the other hand, to know precisely the total bytes occupied by live tuples, a full scan of the entire relation is needed, which puts pressure on the online system’s I/O. If you want to monitor bloat rates for all tables, this approach isn’t suitable.
For example, a 200G relation would take approximately 5 minutes to perform precise bloat rate estimation using the pgstattuple plugin. In version 9.5 and later, the pgstattuple plugin also provides the pgstattuple_approx function, trading precision for speed. But even with estimation, it still takes seconds.
For monitoring bloat rates, the most important requirement is fast speed and low impact. Therefore, when we need to monitor many tables across many databases simultaneously, we need to perform fast estimation of bloat rates to avoid impacting business operations.
Estimating Bloat Rate
PostgreSQL maintains many statistical information for each relation. Using statistical information, we can quickly and efficiently estimate bloat rates for all tables in the database. Estimating bloat rates requires using statistical information on tables and columns. Three directly used statistical metrics are:
- Average tuple width
avgwidth: calculated from column-level statistical data, used to estimate space occupied in compact state - Tuple count:
pg_class.reltuples: used to estimate space occupied in compact state - Page count:
pg_class.relpages: used to measure actually used space
The calculation formula is also simple:
Here block_size is page size, default 8182, pageheader is header overhead, default 24 bytes. Page size minus header size gives actual space available for tuple storage. Therefore, (reltuples * avgwidth) gives estimated total tuple size, and dividing by the former gives expected pages needed to compactly store all tuples. Finally, expected page count divided by actual page count gives utilization rate, and 1 minus utilization rate gives bloat rate.
Difficulties
The key here is how to use statistical information to estimate average tuple length. To achieve this, we need to overcome three difficulties:
- When tuples contain null values, headers will have null bitmaps
- There’s padding between headers and data sections, requiring boundary alignment consideration
- Some field types also have alignment requirements
Fortunately, bloat rate itself is an estimation, so being roughly correct is sufficient.
Calculating Average Tuple Length
To understand the estimation process, we first need to understand PostgreSQL’s internal layout of data pages and tuples.
First, let’s look at tuple average length. The tuple layout in PostgreSQL is shown in the diagram below.

Space occupied by a tuple can be divided into three parts:
- Fixed-length line pointer (4 bytes, strictly speaking this isn’t part of the tuple, but it corresponds one-to-one with tuples)
- Variable-length header
- Fixed-length part 23 bytes
- When tuples contain null values, a null bitmap appears, with each field occupying one bit, so its length is the number of fields divided by 8
- After the null bitmap, padding is needed to
MAXALIGN, usually 8 - If the table has the
WITH OIDSoption enabled, tuples also have a 4-byte OID, but we don’t consider this case here
- Data section
Therefore, a tuple’s average length (including corresponding line pointer) can be calculated as:
The key is finding average header length and average data section length.
Calculating Average Header Length
The main variables in average header length are null bitmap and padding alignment. To estimate average tuple header length, we need several parameters:
- Average header length without null bitmap (with padding):
normhdr - Average header length with null bitmap (with padding):
nullhdr - Proportion of tuples with null values:
nullfrac
The formula for estimating average header length is also very simple:
Since headers without null bitmaps are 23 bytes long, aligned to 8-byte boundaries gives 24 bytes, the above formula becomes:
To calculate the length of a value padded to 8-byte boundaries, use this formula for efficient computation:
Calculating Average Data Section Length
Average data section length mainly depends on each field’s average width and null rate, plus trailing alignment.
The following SQL can calculate average tuple data section width for all tables using statistical information:
For example, this SQL can get average tuple length for table app.apple from the pg_stats system statistics view:
Integration
Integrating the logic from the above three sections, we get the following stored procedure that returns bloat rate for a given table:
Batch Calculation
For monitoring, we often care about not just one table, but all tables in the database. Therefore, the above bloat rate calculation logic can be rewritten as a batch calculation query and defined as a view for easy use:
Although it looks long, querying this view to get bloat rates for all tables in the entire database (3TB) takes only 50ms of computation. And it only needs to access statistical data, not the relations themselves, consuming no instance I/O.
Handling Table Bloat
If it’s just a toy database, or the business allows long daily downtime for maintenance, then simply executing VACUUM FULL in the database would suffice. But VACUUM FULL requires exclusive read-write locks on tables. For databases that need to run continuously, we need to use pg_repack to handle table bloat.
- Homepage: http://reorg.github.io/pg_repack/
pg_repack is included in PostgreSQL’s official yum repository, so it can be installed directly via yum install pg_repack.
Using pg_repack
Like most PostgreSQL client programs, pg_repack also connects to PostgreSQL servers through similar parameters.
Before using pg_repack, you need to create the pg_repack extension in the database to be reorganized:
Then you can use it normally. Several typical usage patterns:
Detailed usage can be found in the official documentation.
pg_repack Strategy
Usually, if business has peak and valley cycles, you can choose to perform reorganization during business valleys. pg_repack executes quickly but is resource-intensive. Running during peak periods might affect overall database performance and could cause replication lag.
For example, you can use the bloat rate monitoring views provided in the above two sections to daily select the most severely bloated tables and indexes for automatic reorganization.
Here, three rules are set:
- From small tables < 256MB with bloat rate > 40%, select TOP64
- From medium tables 256MB to 1GB with bloat rate > 40%, select TOP16
- From large tables 1GB to 4GB with bloat rate > 20%, select TOP4
Select these tables for automatic reorganization during early morning valleys. Tables over 4GB are handled manually.
But when to perform reorganization still depends on specific business patterns.
pg_repack Principles
pg_repack’s principle is quite simple. It creates a copy for the table to be rebuilt. First, it takes a full snapshot, writes all live tuples to the new table, and synchronizes all changes to the original table to the new table through triggers. Finally, it replaces the old table with the new compact copy through renaming. For indexes, this is accomplished through PostgreSQL’s CREATE(DROP) INDEX CONCURRENTLY.
Reorganizing Tables
- Create an empty table with the same schema as the original table but without indexes
- Create a log table corresponding to the original table to record changes that occur on that table during
pg_repackoperation - Add a row trigger to the original table to record all
INSERT,DELETE,UPDATEoperations in the corresponding log table - Copy data from the old table to the new empty table
- Create the same indexes on the new table
- Apply incremental changes from the log table to the new table
- Switch new and old tables through renaming
- Drop the old, renamed table
Reorganizing Indexes
- Use
CREATE INDEX CONCURRENTLYto create a new index on the original table, maintaining the same definition as the old index Analyzethe new index, set the old index as invalid, and swap new and old indexes in the data directory- Delete the old index
pg_repack Considerations
Before starting reorganization, it’s best to cancel all ongoing
VacuumtasksBefore reorganizing indexes, it’s best to manually clean up queries that might be using those indexes
If abnormal situations occur (like forced exit midway), garbage might be left behind that needs manual cleanup. This might include:
- Temporary tables and temporary indexes built in the same schema as the original table/index
- Temporary table names:
${schema_name}.table_${table_oid} - Temporary index names:
${schema_name}.index_${table_oid}} - Related triggers might remain on the original table and need manual cleanup
When reorganizing particularly large tables, reserve at least the same amount of disk space as the table and its indexes, requiring special care and manual checking
When completing reorganization and performing renaming replacement, massive amounts of WAL will be generated, possibly causing replication delay that cannot be canceled